2020-07-14 – If you’re interested in building a ballistic chronograph, check out the new 3D-printed MK2 design at td0g.ca/2020/04/19/ballistic-chronograph-mk2-diy/. If you would like to purchase sensors for building a chronograph, they are available at https://www.tindie.com/products/19828/.
Preamble:
A ballistic chronograph is an instrument which measures the speed of very fast things (like bullets). I decided to build a DIY Chronograph which could be used for high-speed photography, such as glassware getting shot with an air-powered rifle (see my other post on this topic or my Flickr album). In order to take such a photo, you need to be able to trigger a flash at just the right moment, which will freeze all the juicy action.

There are numerous resources available which give very limited information on how to build such an instrument. Unfortunately all of the resources are incomplete or describe an instrument which only works for slower objects, such as paintballs or airsoft pellets. I designed and built this using the information available on the internet, my modest understanding of electronics, and many hours of trial-and-error. To somebody who has some knowledge of electronic components, this post can be used to build an instrument useful for measuring the speed of objects travelling up to 1,000 m/s (such as high-powered rifle bullets), and even photographing a projectile ‘interacting’ with other objects!
Basic Principles (for the uninitiated):
The principle behind optical ballistic chronographs are simple, but here’s a basic overview of how the instrument works. Two optical gates are mounted a certain distance apart. I’ll get into how the optical gates work in a minute, but their sole purpose is to detect when something is passing through the gate and sending an electric signal back to the controller. When something passes through the first gate, a controller will recieve a signal and start a stopwatch. Then a short time later, that object passes through the second gate and the controller gets the second signal. It will then stop the stopwatch and calculate the speed by dividing the distance between the gates by the time between the signals (v, speed = s, distance / t, time).
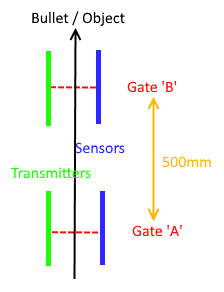
Now back to the optical gates. There are two sides to the gates: an emitter side and a sensor side. The bullet or other object needs to pass between the emitter and sensor. The emitter has an array of LED’s and its job is to provide a very constant light source. There is no feedback from the emitter, it just provides light. The sensor is the part that actually provides a signal to the controller. It contains an array of sensors, and each sensor gets a basic circuit that does two things: 1. It sets a baseline for the expected amount of light received, and 2. It sends an electric signal when the amount of light detected is lower than that expected amount.
So what happens is that the emitter array gives each sensor a very stable supply of light, and each sensor automatically sets its baseline to that exact amount of light. Therefore, the sensors will not normally send a signal to the controller. However, when something interrupts one of the paths of light to any of the sensors, that sensor will detect that there is less light than there should be – and it sends a signal! It just takes one sensor to send the signal, which makes the instrument very sensitive.
Physical Design:
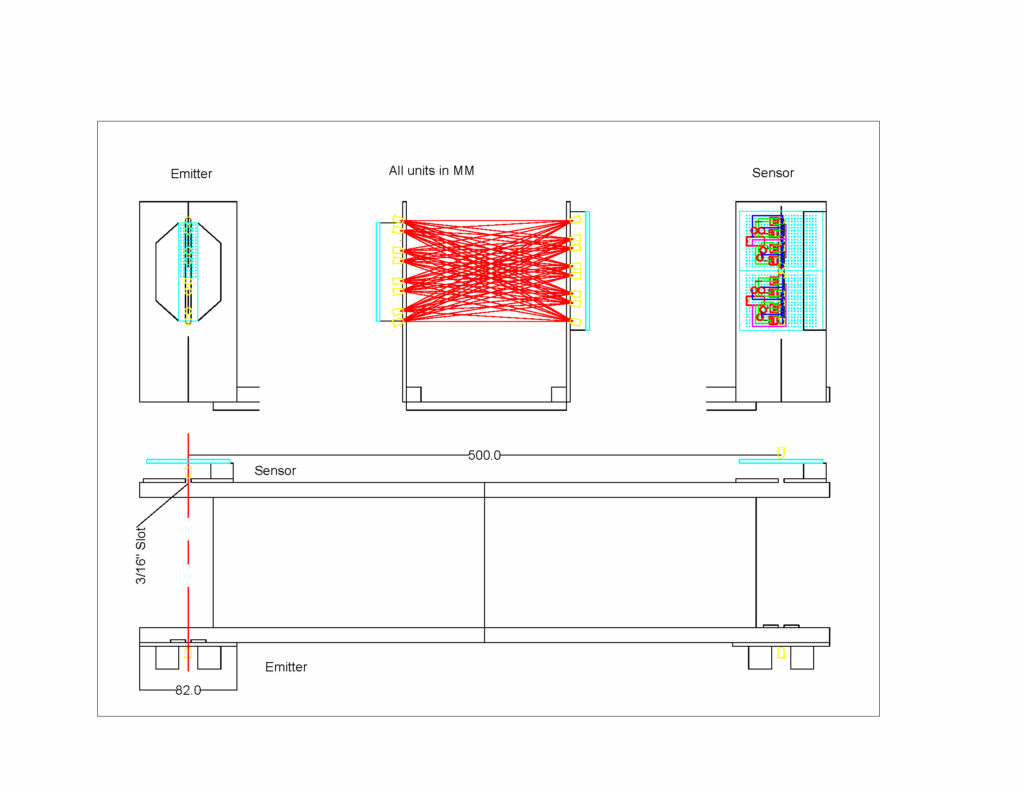
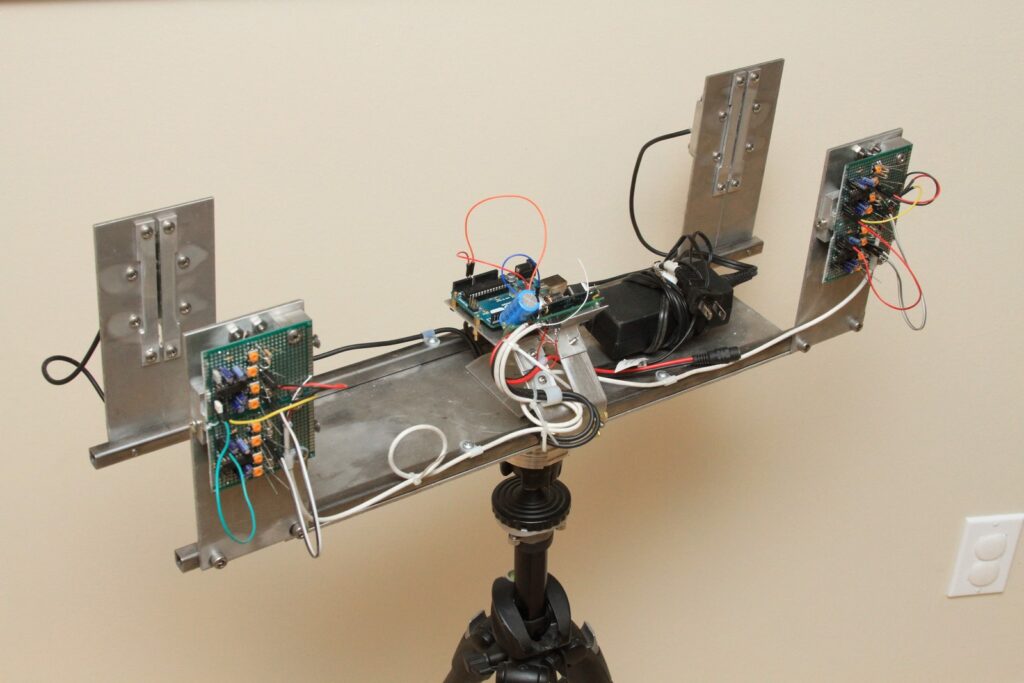
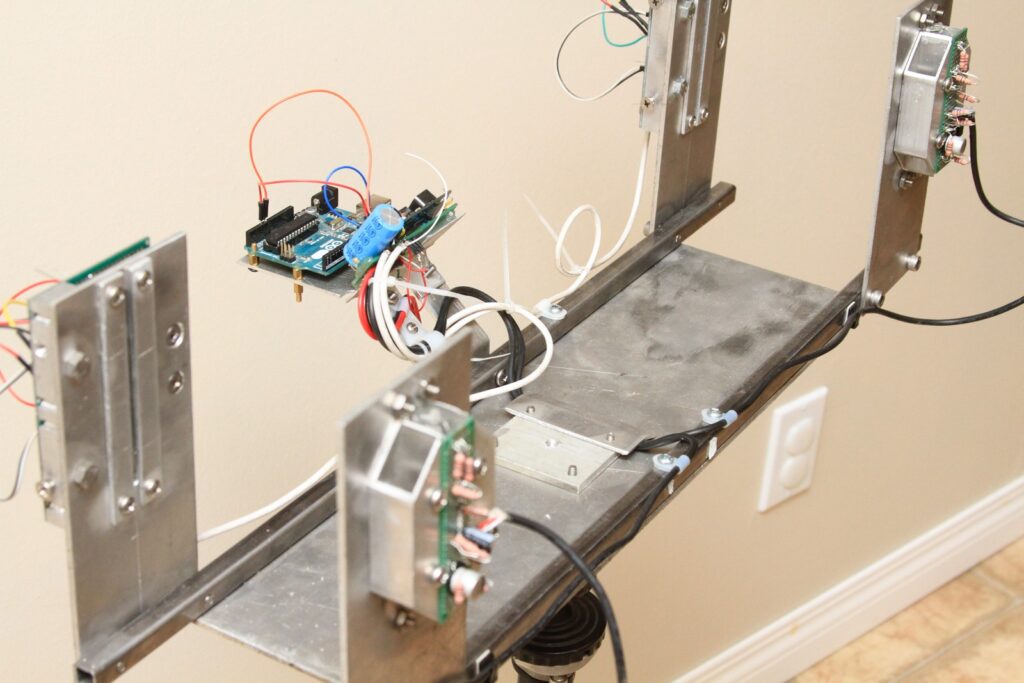
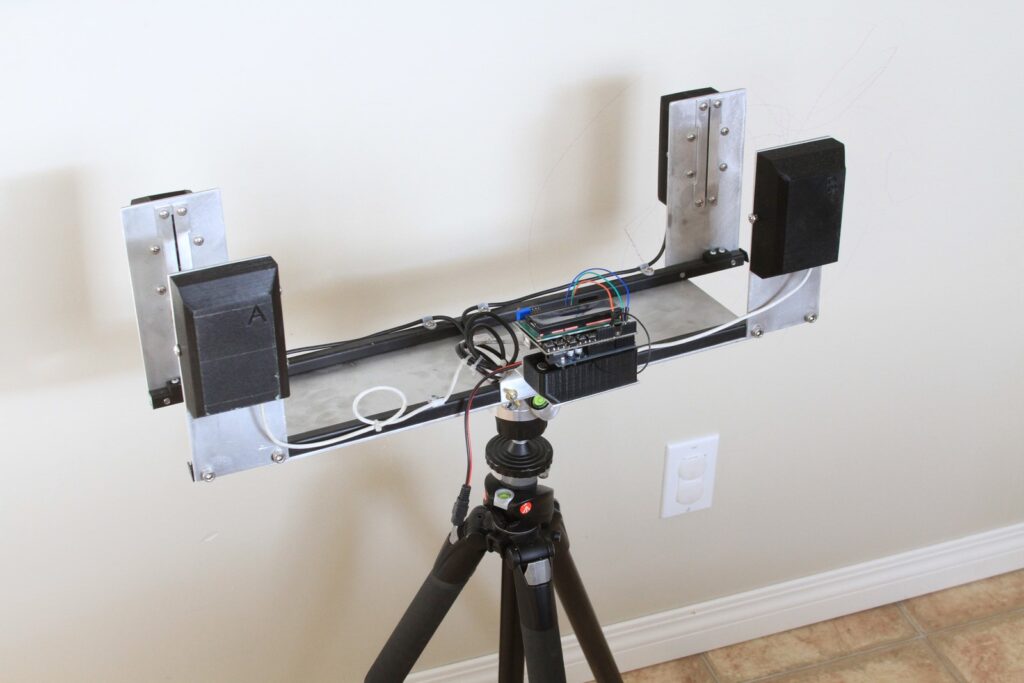
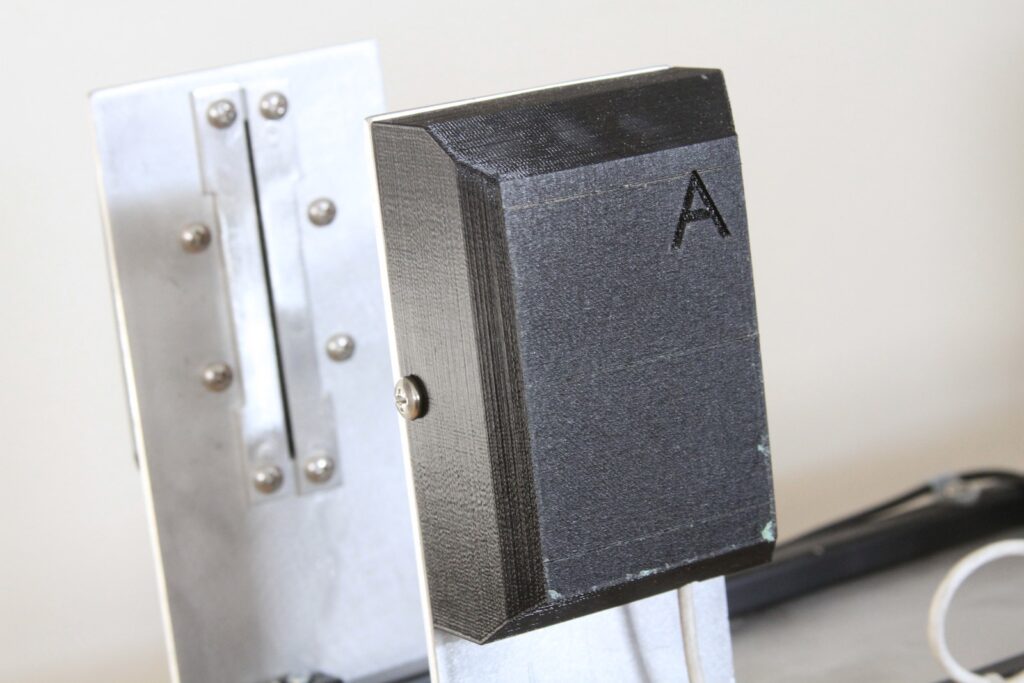
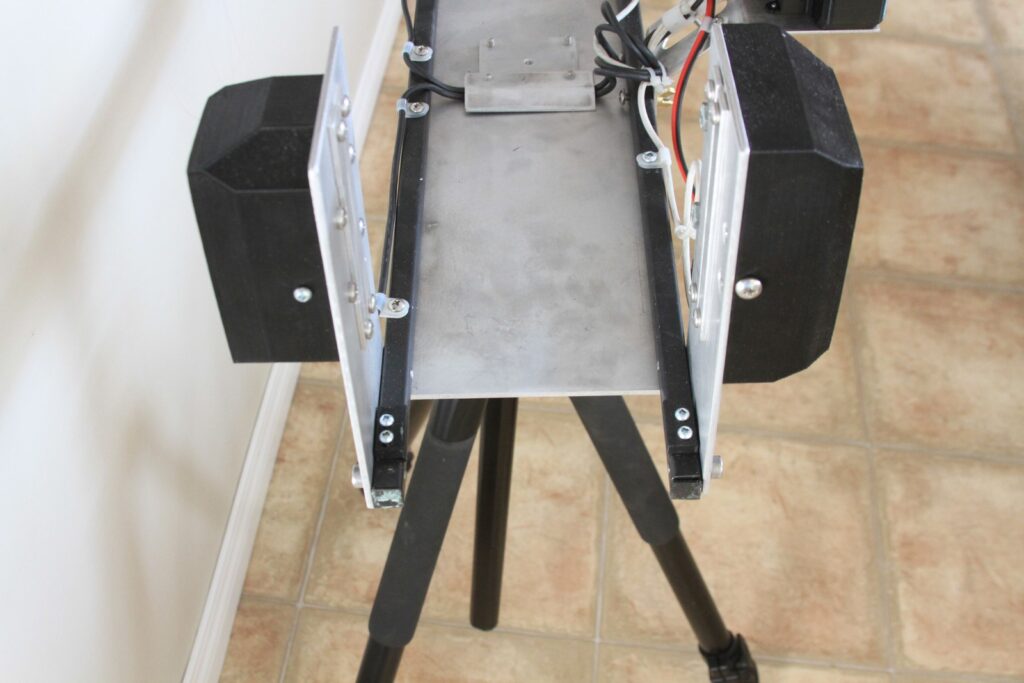
I arbitrarily set the optical gates 500 mm apart. This made it reasonably compact while reducing the amount of error in the results. The instrument’s frame was built from 1/2″ square steel tubing and flat sheets of aluminum. It is fastened with screws, and critical component locations can be adjusted. The unit can rest on any flat surface, and eventually will be able to mount onto any standard tripod with a 1/4″ thread. A controller platform with hand-removable fasteners is mounted on the side and can be removed for storage. The covers for the electronics were 3D printed.
Sensors:
Commonly-used light sensors include photoresistors and phototransistors. Unfortunately these types of sensors do not work for the high demands of a ballistic chronograph measuring supersonic bullets! Here’s why: A bullet is only a few mm long and can travel relatively fast. I decided to design for a bullet 5mm long travelling 1,000 m/s. That means that, assuming the optical paths are infinitely thin, the bullet will interrupt an optical path for 5 μs (microseconds). If anyone can find a phototransistor that will respond in less than 5 μs, please let me know!
So, since the primary issue for the sensors was speed, I used LED’s photodiodes configured in a photoconductive (reverse-biased) setup. This means that relatively high voltage (~27 V) is applied to the diodes BACKWARDS, and the voltage drop across each photodiode was monitored to detect any fluctuations. These sensors can have sub-microsecond response times. The topic of using photodiodes as sensors is discussed very well in this resource from OSI Optoelectronics.
The system uses near infrared light (890 nm wavelength) for two reasons: first, the ambient level of infrared light typically isn’t as high as visible light (less interference), and second, suitable infrared sensors were readily available at the time. The LED emitters are TSHF5410 LED’s and the receivers (sensors) are LTR-323DB photodiodes (available from Digikey).
I worked for a while to determine how the sensors and emitters should be arranged to reduce the size of the holes between the optical paths. The positioning of the sensors and emitters was optimized such that a .177 guage bullet could not pass through the sensing area (135 mm wide by 85 mm tall) without interrupting the path of light between at least one emitter and one sensor. CAD software was used to optimize the placement of the components, as well as to map the circuitry onto blank PCB boards (see the drawing below, red lines are the optical paths). In the end, each gate consisted of an infrared emitter array containing eight LED emitters and a sensor array containing eight photodiode sensors. I found the most efficient placement of the sensors and emitters interesting, have a look at the CAD drawing in the repository at the end for more detail.
As discussed above, the sensor array circuitry was designed such that the system would automatically normalize (set a baseline) after a brief period of time, and any slight disruption of the light paths would instigate an electrical signal. The circuit diagram and design on a 5 x 7 cm PCB are included in the repository.
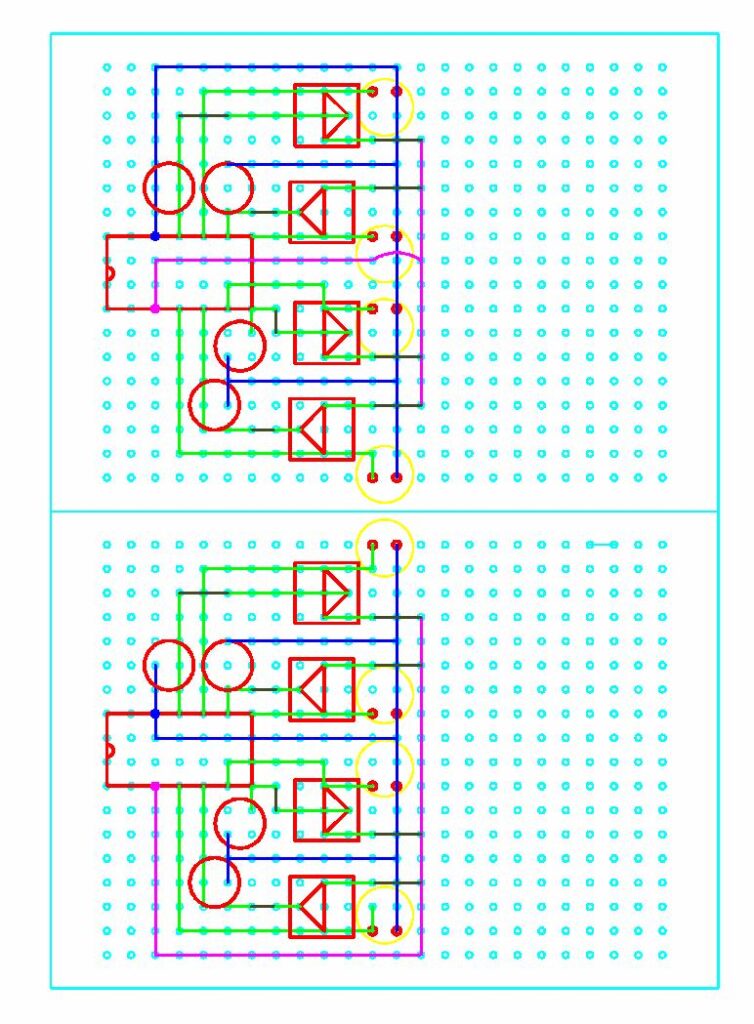
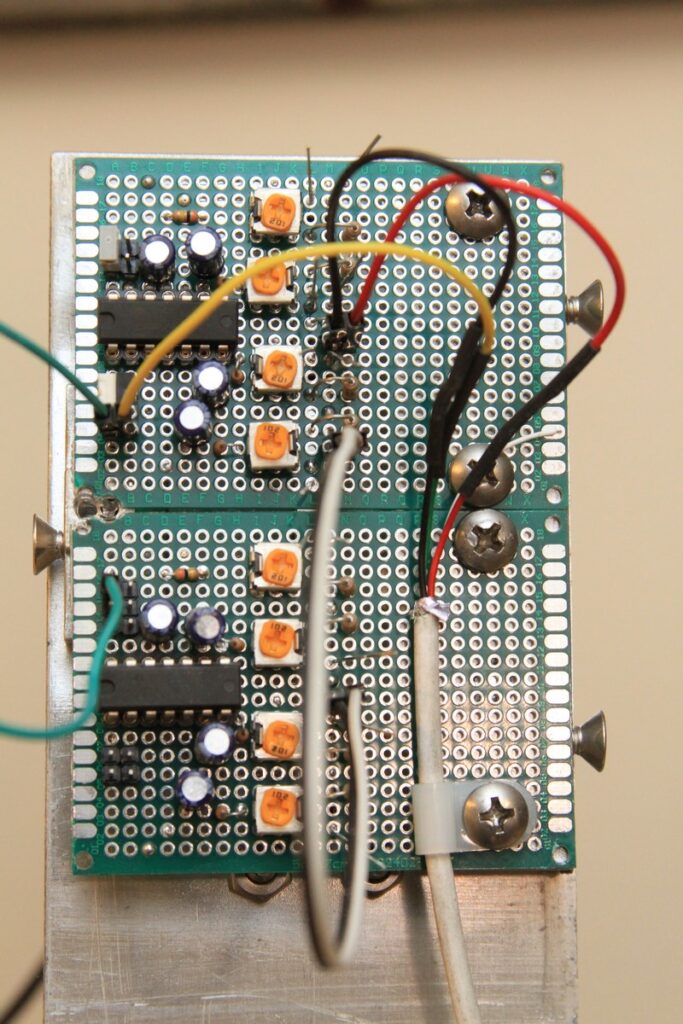
Each sensor array is built on two PCB’s (four sensors per PCB), with jumper wires connecting the power and signal lines for each PCB. Each photodiode sensor is reverse-biased with approximately 27 V, which is supplied by a 5-40 V boost regulator (eBay). The regulator provides surprising stable power, and I did not have to add any capacitors to the output. The voltage drop across the photodiode changes as it is exposed to different amounts of infrared light. The raw sensor voltage output is connected to one side of an LM339 comparator (the LM339 package conveniently has four comparators, so one LM339 per board). The other side of the comparator is biased slightly positive (~40 mV), and connected to a capacitor. Potentiometers are used to adjust the positive bias (which changes the sensitivity to changes in light). This allows the sensors to automatically normalize in any condition. When a small amount of light is suddenly blocked, the sensor voltage drop increases and instantly rises above the capacitor’s voltage, which rises slowly. The comparator connected to the sensor will then close the signal line to ground, communicating to the microcontroller that an object has been detected.
Since all eight comparator outputs are connected to the same signal line, any one of the comparators can send a trigger. Each comparator is connected to the signal line by a removable jumper. This allows troubleshooting if there are any issues with individual sensors, as a single sensor can be isolated and tested. A re-purposed USB cable carries the power, ground, and signal lines from the controller to the sensors. There hasn’t been any apparent issues with providing almost 30 V through the cable, which is typically used for 5 V. Keep in mind that each sensor array draws less than 3 mA, so there is very little power consumption.
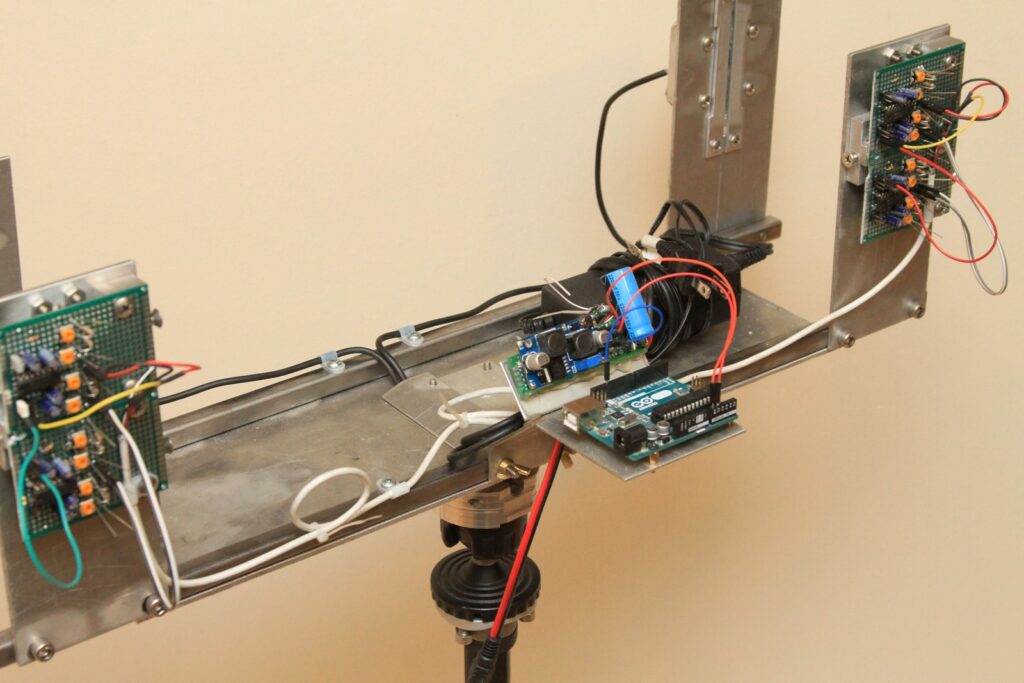
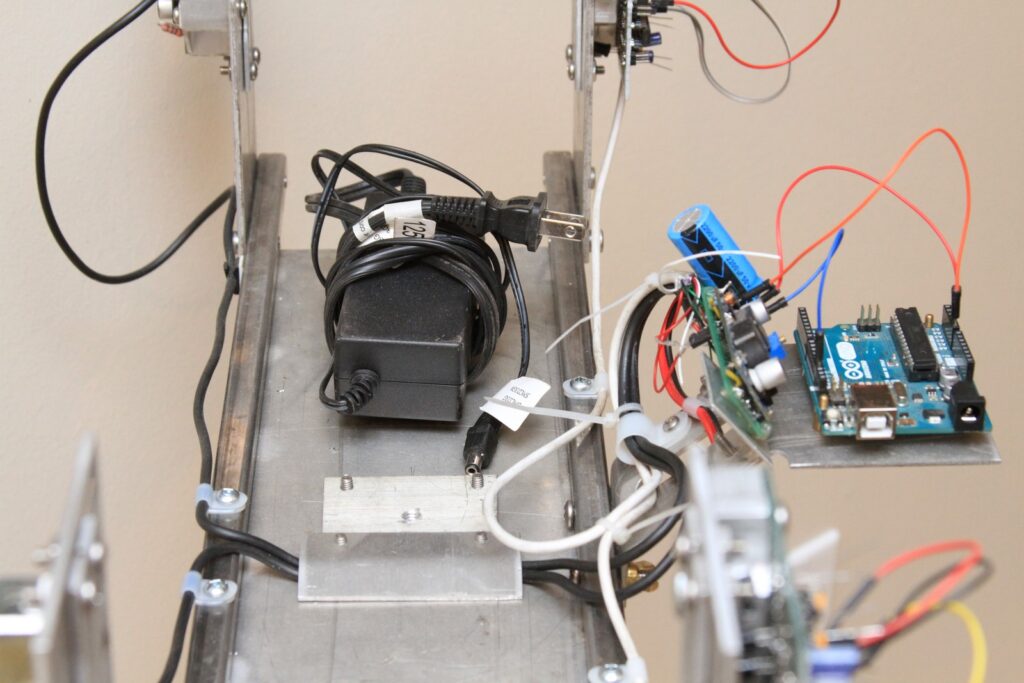
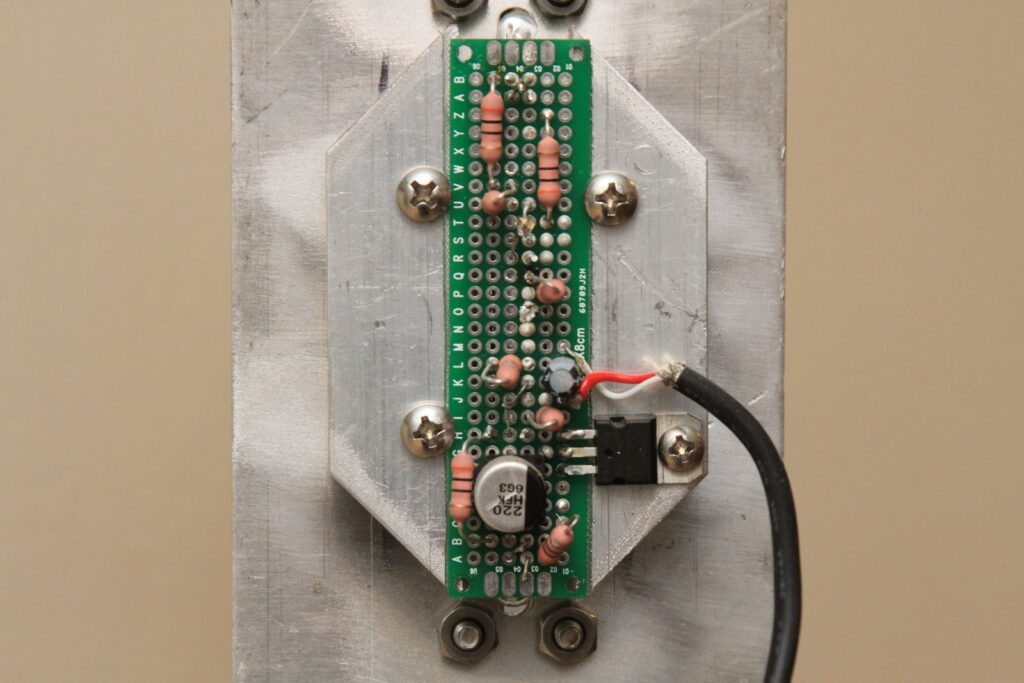
The end goal of the emitter arrays was to provide a very (!) constant amount of light with power from a 12 V wall transformer or lead-acid car battery. Unfortunately those power supplies are not stable enough to keep the light level constant. Each gate draws approximately 400 mA of current at >12 V. I added a 2200 μf capacitor to the supply lines so to smooth out the heavy, low-frequency ripples from a wall transformer. After that, each emitter array has an LM7809 voltage regulator which drops the voltage to a very stable 9 V. Finally, resistors placed in series with the LED’s further aid in smoothing the light output of the LED’s. About 68% of the power provided by the regulator is absorbed by the resistors. The arrays are inefficient, but the resulting light output is very constant and therefore the sensors can be adjusted to high sensitivities. The circuits were built on blank 2 x 8 cm PCB’s.
Controller:
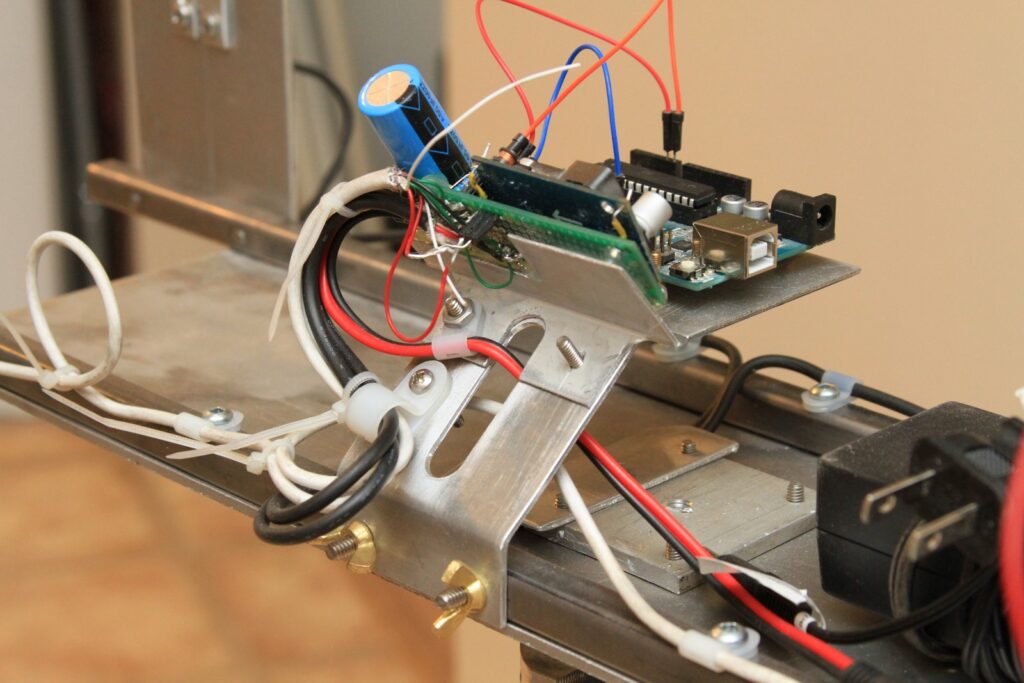
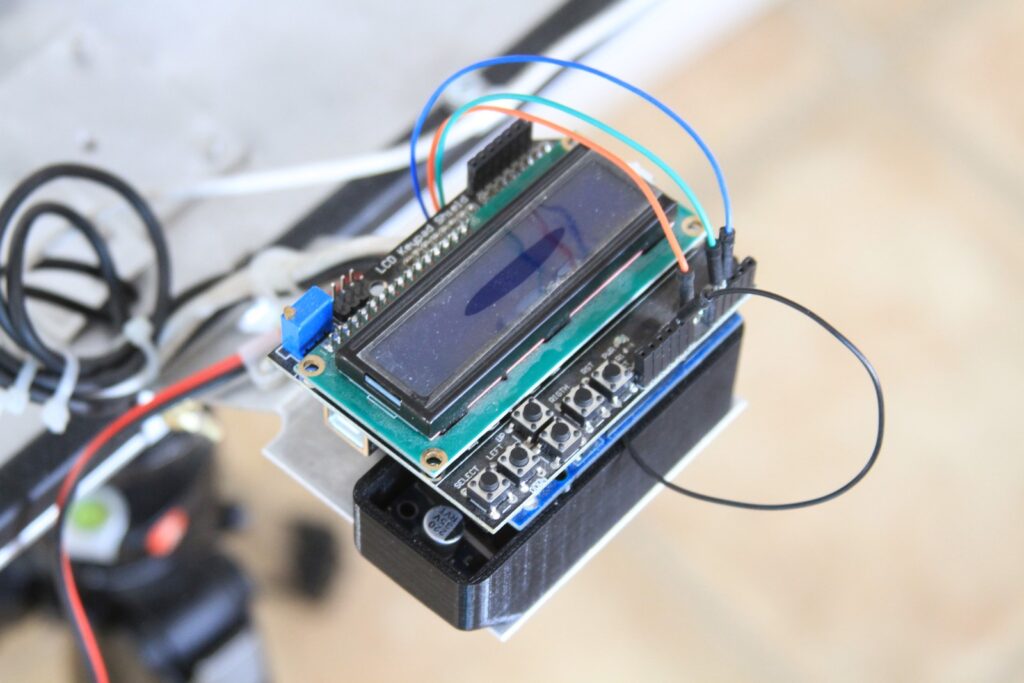
The TTL-level outputs from the sensor arrays were connected to an Arduino Uno, which has a maximum digital sampling rate of 2 MHz and maximum clock resolution of 0.5 μs. In order to reach these rates, a couple tricks are required in the programming. First, instead of using digitalRead(), we are directly reading a whole register and parsing the result (see this Instructable by JRV31 for more info). All pins on the port (except for the first pin) are pulled down, and the first pin is connected to a sensor array. This means that pins 14-19 (all the pins in port C) are used just to read two sensor inputs. Pins 0-13 (ports B & D) are available for serial comms, triggers, lcd output and user controls. Now that the sampling rate is up to max speed, we need to increase the clock resolution. Instead of learning about the ATMEGA’s clock registers, I’m just going to be using Gabriel Staple’s library to get the 0.5 μs resolution. My working code can be found in my project repository. NOTE: Gabriel’s library doesn’t always get along with the LiquidCrystal LCD library. If you use both, be sure to disable Gabriel’s library before printing on the LCD, then enable when your done. This cane be done by calling Timer2.revert_to_normal() and Timer2.setup() respectively.
Of course, the clock accuracy of the controller has to be taken into account. I tested the clock speed of an Arduino Uno R3 and a cheap knock-off Uno. At 18 degrees C, heir clock speeds were 0.1% fast and 0.9% slow, respectively. Once these values are known, it’s very easy to compensate for the inaccuracy in the code.
Future Changes:
Currently, the instrument is functional but needs more work. 3D printed LED / photodiode support manifolds would be great to hold each sensor and emitter in their correct position, although it seems to work fine as-is without any additional supports. Eventually I would like to replace the LM339’s with a faster comparator, although they seem to function very well (It turns out that the LM339 has about 100ns delay, which is plenty fast enough to capture a high-powered rifle round). Custom printed boards would look much nicer than the blank perforated PCB’s, so I may go that route when other upgrades are performed.
Triggering Speedlight Flashes:
Since the orignal goal was to take high-speed photos, I’ll just add a little note about triggering flashes for high-speed photography. I’ve found that all of my Yongnuo and Nikon speedlight flashes have differing delays between the time they were triggered to the time they flash. As such, the delay compensation value (or delay comp) must be calibrated for each flash. The Arduino code provided allows for multiple flashes to be triggered simultaneously, even if they have varying delays. The delay comp can be calculated for each flash separately by photographing a high-speed object (bullet) with a delay comp of zero, then measuring how far past the expected location the imaged bullet was, and dividing that distance by the bullet’s speed. I’ve measured delay comps between 150 μs (Nikon SB-800) to excess of 400 μs (Yongnuo YN-560).
Photographic Results:
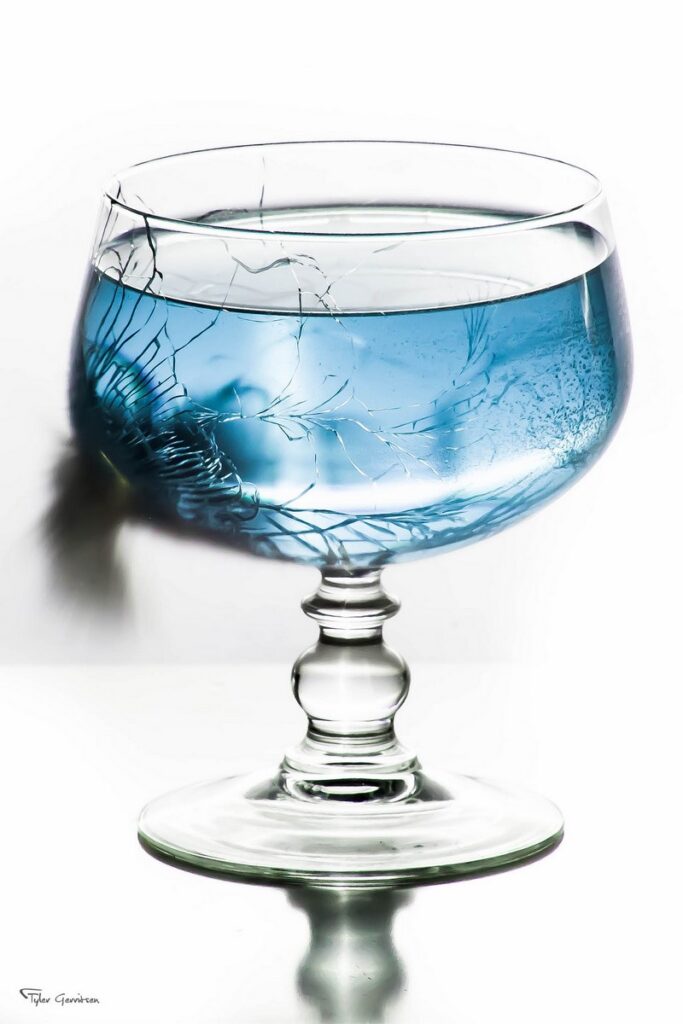
Below is a photo of a 7.62mm round travelling 730 m/s (2400 fps) striking a glass cup. The trigger time was controlled with this ballistic chronograph. I will report back when all improvements are completed!
1 thought on “Ballistic Chronograph #DIY”